The Rim Fire raging uncontrolled near Groveland, California and Yosemite National Park continues to grow, now covering a sprawling tract more than 200 square miles — an area roughly the size of the city of Chicago. The blaze, which has so far consumed some 144,000 acres and pulled over 3,000 firefighters into battle, was only 7% contained Monday morning and continuing to spread northeast and east, menacing some 4,500 nearby homes, cabins and businesses, reports CBS News.
The fire also threatens both water and power sources for the San Francisco Bay Area as well as several groves of towering sequoias — some of the oldest living things on the planet, which only grow on the western slopes of the Sierra Nevada, reports the AP. “All of the plants and trees in Yosemite are important, but the giant sequoias are incredibly important both for what they are and as symbols of the National Park System,” said Yosemite park spokesman Scott Gediman told the AP this weekend.
According to California Fire Department info dispatcher Daniel Berlant, the fire has reach historically epic proportions:
“Everyone is heads up 24/7 when they’re out here, boots on the ground,” fire safety officer Sam Lobese told CBS News. “They’re looking up at the trees, watching the smoke column, watching what it’s doing. If it’s running on top of the trees, it’s very difficult to put that out, it’s almost impossible.”
It’s not clear how many people have been evacuated, but while orders to leave have been lifted in some areas as the fire moves through, new evacuation orders were just issued for Ponderosa Hills and Tuolumne City near Groveland (just northwest).
Like the Waldo Canyon “Super Fire” last summer, it’s possible to keep track of the Yosemite-area fire using high-tech mapping tools from outfits like Esri (a company that specializes in what’s known as geographical information systems, or GIS). These tools offer much more than just a birds-eye view of the fire’s scope, some of them providing information about evacuation areas and shelters for both people and pets.
Here’s a quick list of some of the best:
Esri Public Information Map
Esri’s wildfire map offers a Google Maps-like view of the U.S. capable of displaying the “real-time effects of extreme weather and other natural disasters.” The picture above with the giant red splotch dominating is of the Rim Fire (the red area indicates its scale). In addition to keeping tabs on the scope of the wildfire, Esri serves up crowdsourced information sampled from social sites like Twitter, YouTube and Flickr. If you click the “Social” link top right and fiddle with the keyword options or date ranges, you can get the map to vary its social content as well.
The topographic features are pretty nifty, too, displaying height contours and letting you toggle overlays like “Current Wind Conditions,” “Precipitation” and “Wildfire Potential.” Since I fiddled with the map last summer, Esri appears to have added a few new Basemap features, too, including the option to simplify the display graphics, if scrolling seems slow (as it does on my Retina MacBook Pro in Safari 6, given the exceptional amount of detail being rendered).
89.3 KPCC Fire Tracker
I noticed this while browsing NPR’s The Two-Way this morning: an elegant info aggregation page from Southern California Public Radio that lays out salient information about the Rim Fire in a quick, easily readable format, from current containment estimates (7%) and acres burned (143,980) to structures threatened (4,500), structures destroyed (23) and injuries (2). The site also aggregates Twitter dispatches about the Rim Fire, resources deployed (personnel, fire engines, air tankers, water tenders, etc.) and information about road and school closures.
California Fire Map
Provided by the California Department of Forestry and Fire Protection, the California Fire Map employs Google Maps to provide “general locations of major fires burning in California.” While the locations are approximate and lack Esri’s detail and fidelity, the wildfire flash points provide links to InciWeb, or “Incident Information System,” another aggregation service collating information from federal, state and local agencies with a dedicated Rim Fire page that summarizes evacuation announcements, offers Rim Fire news updates, photos, closures, additional maps, contact information and more.
Climate Central
Independent climate change science group Climate Central says its interactive map is based on data from the Geospatial Multi-Agency Coordination Group. It’s only updated once daily based on reports from local fire managers combined with satellite and GPS info, but if you zoom to each fire and click the red outline area, you’ll get a popup that includes, among other things, the estimated cost of the blaze to date — for the Rim Fire, Climate Central’s map pegs the figure at $20.1 million.
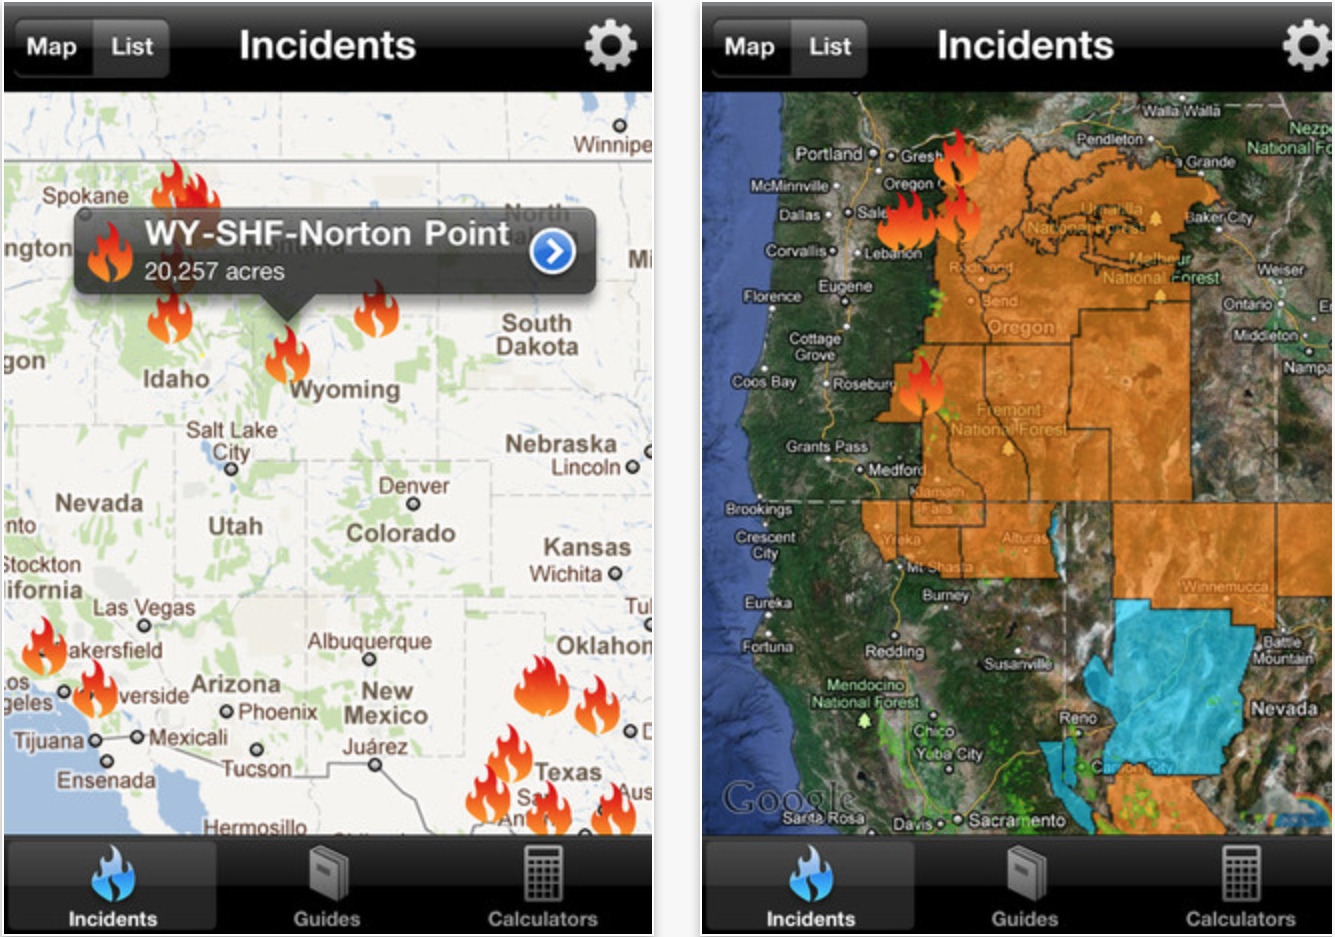
Wildfire Info
The prior four trackers are all web-based, requiring a computer (or fussing with a tablet browser, or squinting at the browser on your smartphone). If you want a mobile-native tool, the one I mentioned last summer — Wildfire Info — still looks to occupy the top spot.
That said, the free version, which uses info from emergency service site Firewhat.com, doesn’t offer much: a map showing the fire’s perimeter and current acres consumed, containment and latitude/longitude coordinates. On the other hand, it seems reasonably up-to-date (the latest news reports this morning indicate Rim Fire containment may have risen to 15%, which Wildfire Info was showing before some of the web tools above). A $4.99 “Pro” version adds features like fire calculators (Weather, FDFM/PIG), quick reference guides and the options to add custom overlays including severe weather and NEXRAD radar.